You already have the data. Every registration, every session selection, every custom field response…sitting somewhere in your event platform, full of insights about your attendees, your content, and your event performance.
The million-dollar question has always been: how do you actually use that data, and frankly, how do you find the time to dig into it between the hundred other things on your plate?
Until now, that meant exporting spreadsheets, bouncing between tabs, and hoping someone had time to crunch the numbers before the next planning meeting. That also meant the deeper insights (the ones that require layering data, spotting patterns across events, or asking a question you didn't know to ask) often had to wait.
AI changes this. But only if your event data can actually talk to your AI tools.
There are a few ways to approach this. You can export your registration data and load it into your AI tool manually...but you'll need to refresh it every time something changes, and real-time pipeline intel isn't really on the table. Many event platforms have built-in AI features, yet they don't always reach your revenue data.
The most seamless way is to connect your AI tool directly to your event platform. Swoogo is the first event management platform to offer that direct connection via a native MCP server, linking the AI tools you already use (Claude, ChatGPT, and others) straight to your event data. That means all the prompts below become fair game, and answerable in seconds.
Use the following AI prompts to get smarter insights that surface patterns, flag gaps, and inform your strategy. Think of these as conversation starters between you, your AI tool, and the event data you've already worked hard to collect.
Connect to the Swoogo MCP Server in 5 minutes
Open your favorite AI tool
Ask. Analyze. Decide.
50 questions to ask your AI tool about your event data.
Tell your AI tool to look at a specific event. With Swoogo's MCP server, you can simply mention the event name or event ID.
You can't program for an audience you don't understand. These prompts help you build a clear picture of who's actually coming into the room.
Break down my registrants for [Event Name or ID] by seniority level based on their job titles. Show me the percentage at each level: individual contributor, manager, director, VP, and C-suite.
Analyze the industries represented using company names from my registrant list. Show me a percentage breakdown by industry, and flag any industries with less than 5% representation.
Based on the industry mix of my attendees, are there content areas or perspectives that seem underrepresented in our current agenda? What sessions might we be missing?
What are the top 10 companies by number of registrants? Show their attendee count and titles. Flag any account sending 3 or more people.
Show me a geographic breakdown of registrants. What percentage are local vs. traveling? Is there a city or region that's surprisingly well-represented?
Segment my registrant list into three personas based on title, industry, and session selections. Give each persona a name and a one-sentence description of what they likely want from this event.
Are there any job titles in my registrant list that appear frequently but aren't represented in our speaker lineup or panel discussions? Who are we not giving a voice to?
Registration data tells you more than just how many people are coming. It tells you who's engaged, where the gaps are, and what needs your attention before it becomes a problem.
What's our registration pace this week versus last week for [Event Name or ID]? Are we trending ahead or behind compared to this same point before the last [Event Name or ID]?
Which registration types are most popular for [Event Name] and what does the mix look like? If we have VIP or paid tiers, what percentage of registrants have selected them?
How many registrants have not yet selected any sessions? Segment them by company and title, then draft a personalized nudge to help them build their agenda.
Looking back at registration data from our last three events, when did the majority of registrations come in? Were there spikes tied to specific promotions or deadlines? Based on this, what would the optimal early bird window and pricing tier schedule look like for our next event?
With Swoogo, you can add custom questions to your registration form. These responses can be some of the richest, most underused data. Here's how to put them to work.
Analyze responses to our registration question about attendee knowledge level. What percentage said beginner, intermediate, or advanced? How should this shape our session difficulty and content framing?
Summarize the most common responses to our open-ended 'What do you hope to learn?' question. Group them into themes, rank by frequency, and flag any themes our current agenda doesn't address.
Do attendees who selected a specific interest at registration tend to also choose certain sessions? Identify correlations between custom field responses and session choices.
Based on all custom question responses so far, what are the top three things attendees seem to care most about? Does our event description and marketing language reflect those priorities?
Looking at one event in isolation only tells part of the story. These prompts help you zoom out to find the patterns, trends, and opportunities that only become visible when you look at the bigger picture.
Compare total registrations for [Event A] this year vs. last year. What's the growth rate? When did registrations spike… and did that pattern repeat? What might explain any differences?
How has our attendee mix by industry changed year over year? Use company names to infer industry. Are we attracting more or less of any particular vertical? And does that align with our go-to-market focus this year to XYZ [insert specific focus or reference point]?
What's our no-show rate trend across the last three events? Is it improving or getting worse? Are there patterns in who tends to no-show (by registration type, company size, region, or how far in advance they registered)?
How have post-event survey results trended year over year? Are satisfaction scores improving? Are there recurring themes in the feedback (positive or negative) that we haven't fully acted on yet? Flag any new feedback this year that didn't appear in previous surveys.
Valuable audience insights live in the patterns across all of your events. These prompts help you understand who keeps showing up, why, and what to do with that.
Identify attendees who have come to more than one of our events in the past 12 months, including webinars. What sessions and topics did they engage with across both digital and in-person events? What does that tell us about their interests, and what should we be offering them next?
Are there attendees who went to our regional events but not our flagship conference? What are their titles and industries? Should we be extending a more targeted invitation to the annual event?
Which companies are consistently sending people to multiple events? Rank them by total attendance across all events this year and flag any that seem underrepresented relative to their account size.
Who attended last year's event but hasn't registered yet this year? Segment by title and company size. Draft a re-engagement message that acknowledges they've been before and gives them a compelling reason to come back.
Are there attendees who have come to every event in our series? Create a loyalty list and flag them for a VIP or early access experience at our next event.
Based on session selections and topic interest across all attendees, build me three post-event nurture tracks. For each track, identify the attendee segment it's built for, the theme that ties it together, and suggest 3 to 4 content touchpoints or topics to include in the sequence.
These prompts go beyond what lives in your event platform alone. By connecting your Swoogo data with your CRM, you can start to understand which events are actually driving revenue, influencing pipeline, and moving the needle for your business.
Which accounts that attended [Event Name] currently have open opportunities in Salesforce? Show me the opportunity name, stage, value, and the account contact who attended.
After [Event Name], how many deals were created or advanced in the 90 days following? How many upgrades or expansions can be attributed to accounts that attended? Compare this to accounts that didn't attend.
What's the average deal size for accounts where at least one contact attended one of our events vs. accounts with no event attendance on record? Show me the difference and flag any patterns by event type, industry, or seniority of the attendee.
Show me the event attendance history for every contact tied to our top 10 open opportunities, ranked by deal value and most recent activity.
These prompts help you build a smarter agenda, fix scheduling conflicts before they happen, and give attendees more of what they actually want.
Which sessions have the most waitlist signups? Should we add capacity, add a second run, or make these sessions available on demand post-event?
Are there any time slots where session selection is noticeably lower than others? Could we rebalance the schedule, add programming, or is there a conflict we haven't accounted for?
Look at the sessions selected by VP-level and above attendees. What topics are they gravitating toward? Are we programming enough for senior decision-makers?
Getting the right information to the right people (quickly and in a format they'll actually read) is half the battle. These prompts do the heavy lifting so you can spend less time writing updates and more time acting on them.
Give me a three-sentence registration summary for the leadership team. Focus on total registered, pace vs. goal, and one notable trend in who's attending.
Write a Slack update for my event team on where registration stands. Include total registrants, how we're trending vs. last year, and one action item for this week.
Write a brief post-event summary email to share with our sales team. Highlight: total attendees, top companies in the room, session topics that generated the most interest, and suggested follow-up talking points.
Draft a board-ready one-pager on our event program performance this quarter: events held, total reach, top industries represented, and a headline on attendee trends.
Generate a post-event debrief doc for my internal team. Include: what we planned vs. what actually happened, top three wins, top three things to improve, and recommended changes for next time.
Generic email blasts get ignored. These prompts help you use your event data to send the right message to the right person at the right time.
Give me a list of first-time attendees at this event. Draft a welcome message specifically for them: what to expect, how to prepare, and how to get the most out of the day.
Who attended last year's event but hasn't registered yet this year? Draft a re-engagement email that acknowledges they've been before and gives them a reason to come back.
Identify registrants who are attending alone from their company. Draft a message that highlights the networking and team-learning opportunities they might bring back to their org.
Organize my registered attendees into breakout groups based on industry. For each group, suggest a themed meetup or breakout session topic that would resonate with their shared interests, and draft a short invitation to send to each group before the event.
Draft a post-event follow-up email for attendees who selected sessions on [specific topic]. Include a relevant resource, a teaser for our next event, and a soft CTA.
A [weather event / flight disruption / local emergency] is affecting [city or region]. Cross-reference my registrant list against attendees who are located in or traveling from that area. Give me a list of potentially impacted attendees and draft a short, direct outreach to check in on their travel status and let them know we're aware of the situation.
Events drive revenue, but you have to prove it. With Swoogo's MCP server, you can connect your CRM data with your event data, and then use these prompts to instantly surface revenue insights.
Which of our events this year had the highest concentration of attendees from active sales opportunities? Cross-reference registered accounts with open pipeline in our CRM.
After [Event Name], how many attendee accounts went on to close a deal or upgrade in the following 90 days? What's the average deal size for event-influenced accounts vs. non-event accounts?
What's the estimated pipeline influence of our event program this year? Show total revenue from accounts that attended at least one event vs. accounts that didn't.
Are there any accounts in my registrant list that are currently at risk in our CRM — flagged as churning or overdue for renewal? Surface them so our success team can prioritize outreach before the event.
Show me the accounts attending this event that have the largest expansion potential — high product usage, multiple seats, or flagged upsell opportunities in our CRM. Draft a brief for the sales team for each.
For accounts where multiple employees attended the same event, did deal velocity look different than single-attendee accounts? Does team presence correlate with faster close rates?
Compare the total pipeline value in the room at this year's event vs. last year's. How has the quality of our audience changed from a revenue potential standpoint (not just headcount)?
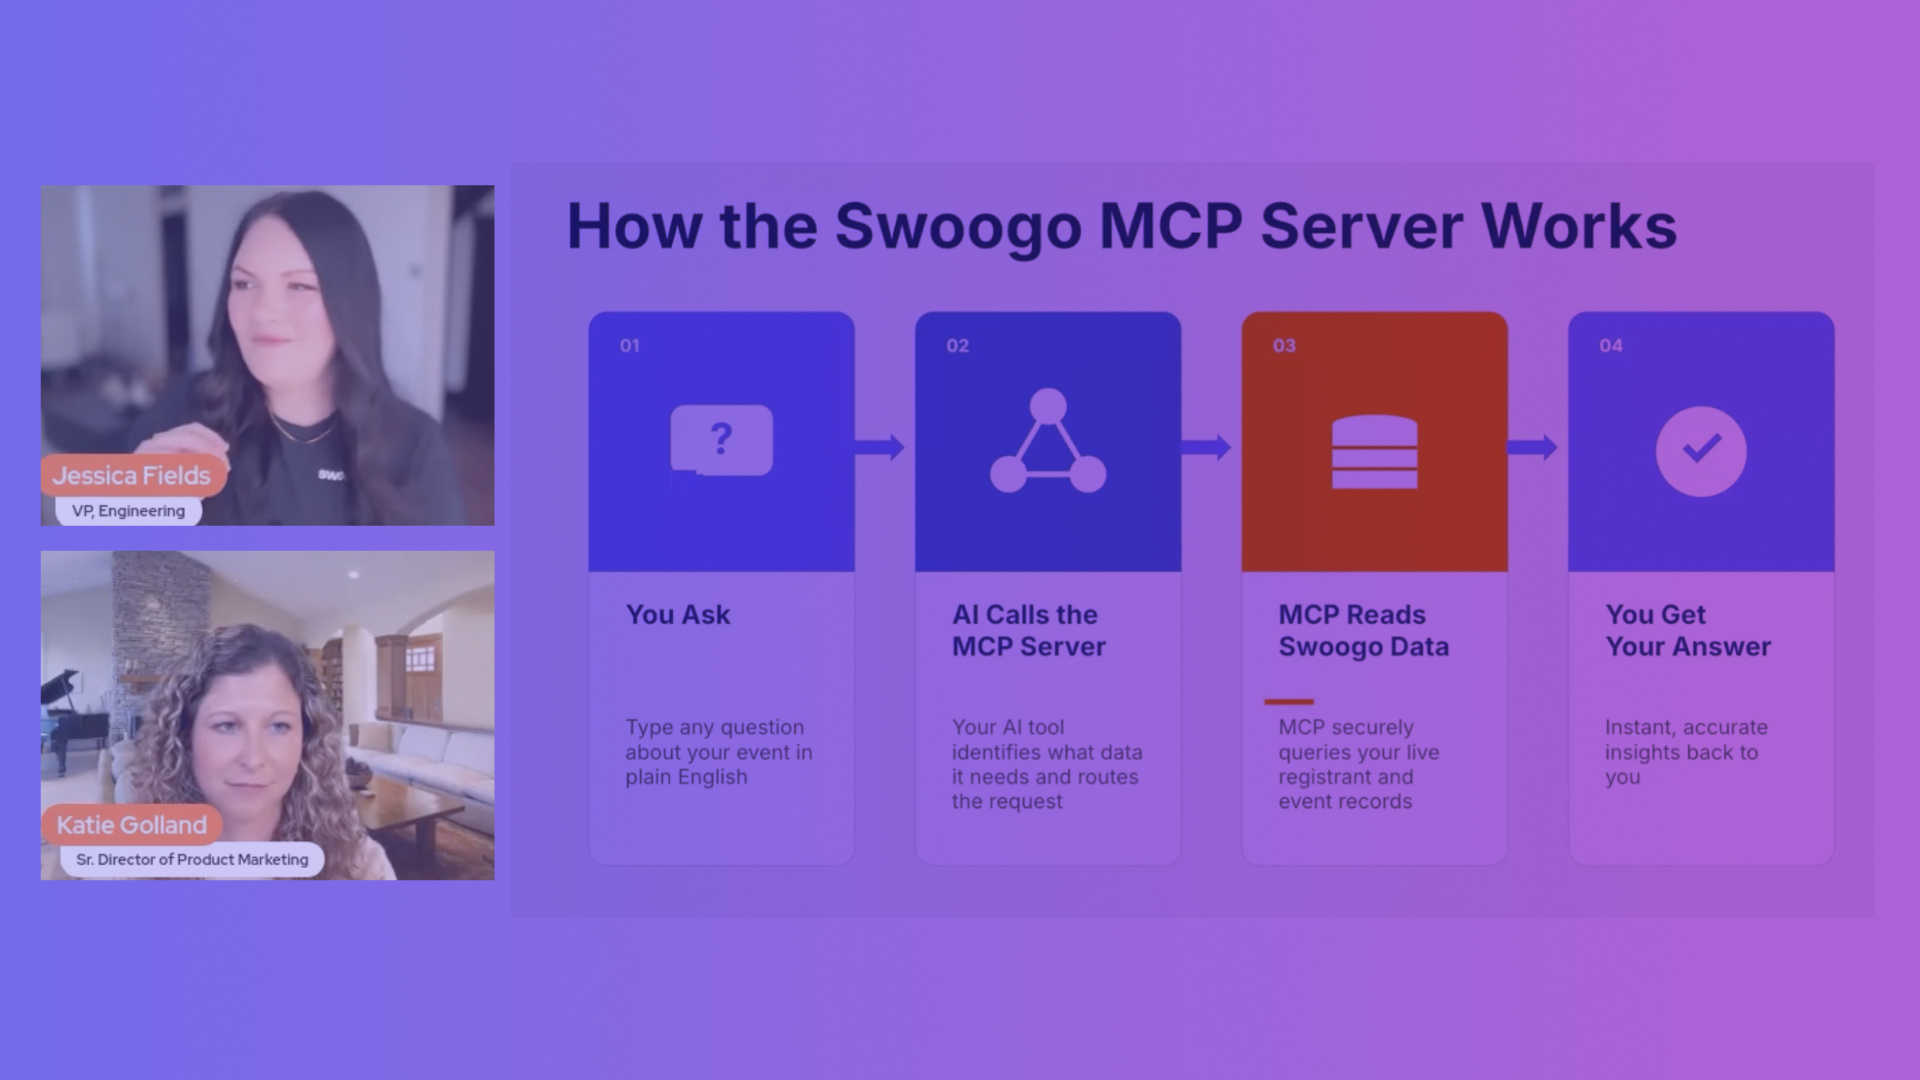
The Swoogo MCP Server connects the AI tools your team already uses (Claude, ChatGPT, and others) directly to your Swoogo account, so you can work with your actual event data in real time. Setup takes five minutes, and then you're getting real answers, fast.
See it in action before you set it up: our on-demand walkthrough shows exactly what it looks like when your event data connects to an AI tool, and the kinds of insights you can pull in seconds.
Watch Now
Embrace your informed era. Fill out this form to keep reading.