Dec 4, 2024
Webhook Dashboard Enhancements

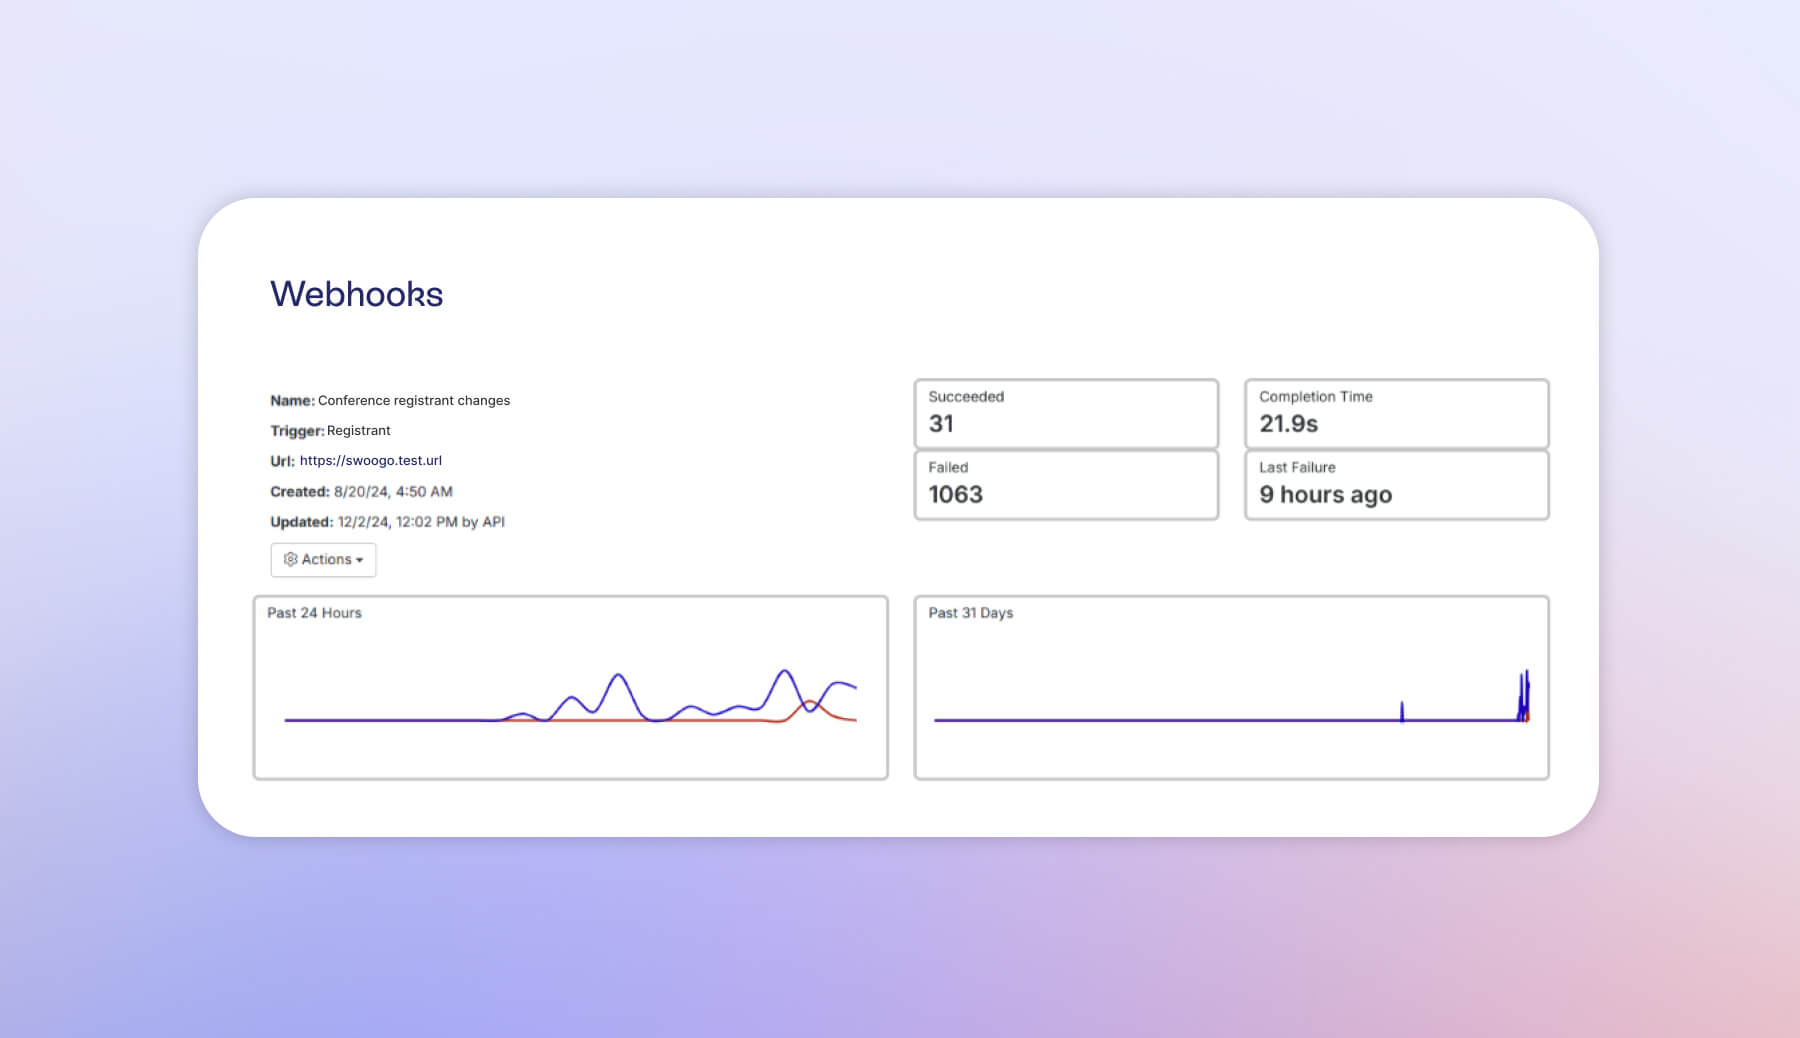
Stay on top of your webhooks at a glance! We’ve added functionality to help you better understand how your webhooks have performed over the past day or month.
See stats showing the last time each of your webhooks was triggered. Click into a specific webhook to see usage graphs and more detailed info, such as processing time, what action triggered it, or sort by webhooks that Succeeded, Failed, or had Status Changes.
You’ll also notice minor UI improvements, like popovers which will keep your dashboard from getting too cluttered and only reveal long strings of information (URLs, debugging details, etc.) when you hover your mouse over a specific area.
